Top>Research and Development>Rod bundle bubble flow visualization experiment based on deep learning
Rod bundle bubble flow visualization experiment based on deep learning
When visualizing measurements inside a rod bundle flow path using bubble detection technology based on deep learning, there is a problem in that it is difficult to identify individual bubbles or perform 3D measurement using conventional visualization methods due to high voif fraction conditions and overlapping and shielding of bubbles inside the structure. In this research, to solve these issues, we developed a 3D visualization measurement method that combines bubble detection technology using deep learning (Mask R-CNN using Swin Transformer) and high-speed camera shooting from two directions.
In addition, to improve visualization of the inside of the flow path, we constructed a rod bundle specimen using a PFA tube with a refractive index similar to that of water, making it possible to observe the dispersed bubble flow in detail. Furthermore, by applying a tracking method (ByteTrack) to the detected bubbles, we evaluated the bubble diameter, velocity, and three-dimensional trajectory.
As a result, we confirmed that overlapping bubbles and bubbles existing behind the rod could be identified to a certain extent, and that it was possible to obtain the three-dimensional distribution of bubbles and the cross-sectional void fraction distribution. Furthermore, under low voif fraction conditions, it was shown that the results agreed well with the measurement results using a wire mesh sensor (WMS), confirming the validity of this method. On the other hand, it became clear that under high voif fraction conditions, the voif fraction tended to be underestimated due to an increase in undetected bubbles.
This research demonstrated the effectiveness of a non-invasive, high-resolution three-dimensional measurement method for dispersed bubble flow in rod bundle channels, and also identified the applicable range and issues.
In addition, to improve visualization of the inside of the flow path, we constructed a rod bundle specimen using a PFA tube with a refractive index similar to that of water, making it possible to observe the dispersed bubble flow in detail. Furthermore, by applying a tracking method (ByteTrack) to the detected bubbles, we evaluated the bubble diameter, velocity, and three-dimensional trajectory.
As a result, we confirmed that overlapping bubbles and bubbles existing behind the rod could be identified to a certain extent, and that it was possible to obtain the three-dimensional distribution of bubbles and the cross-sectional void fraction distribution. Furthermore, under low voif fraction conditions, it was shown that the results agreed well with the measurement results using a wire mesh sensor (WMS), confirming the validity of this method. On the other hand, it became clear that under high voif fraction conditions, the voif fraction tended to be underestimated due to an increase in undetected bubbles.
This research demonstrated the effectiveness of a non-invasive, high-resolution three-dimensional measurement method for dispersed bubble flow in rod bundle channels, and also identified the applicable range and issues.
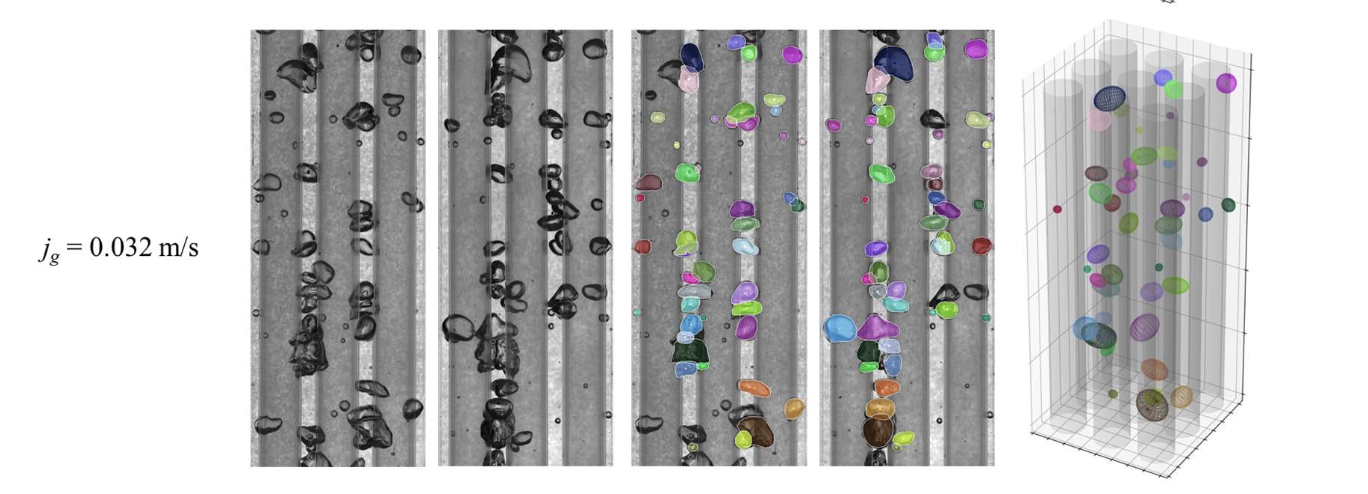
An example of bubble detection technology based on deep learning
reference:Shinichiro Uesawa, Ayako Ono, Hiroyuki Yoshida, 3D visualization measurement in rod bundle flow path using bubble detection technology based on deep learning, Multiphase Flow, 2025, Volume 39, Issue 1, p. 61-71